

 Posted by
When I first heard the phrase “business analytics,” I pictured a dark room full of screens and people in hoodies writing code. The reality, I soon discovered, is much friendlier. Business analytics is simply the practice of using data to make better business decisions. And I will argue in this article that most companies should start smaller and simpler than they think. You do not need a massive budget or a team of data scientists to begin.
You just need curiosity and a willingness to look at what your numbers are telling you. One survey of the field describes business analytics as evidence-based problem solving within business situations. It divides the work into three types: descriptive, predictive and prescriptive. Descriptive analytics asks what happened and why. Predictive analytics asks what is likely to happen next.
Prescriptive analytics goes one step further and asks what decision should be made in response. Each type builds on the one before it. Understanding these three layers of business analytics gives small business owners a clear framework for making smarter decisions without needing expensive software. I find this progression helpful because it reminds me that analytics is not one giant leap. It is a series of manageable steps.
Here is a small example that made things click for me. Imagine a bakery owner who looks at last year’s sales and notices that muffin sales jump every autumn. That is descriptive analytics at work. Next she builds a simple forecast saying how many muffins she will probably sell next October. That is predictive. Finally, she uses that forecast to decide how much flour to order and how many staff to schedule. That is prescriptive analytics in action.
Nothing about it needs a giant budget or a fancy dashboard. Just a spreadsheet and some patience. Does any of this actually pay off? The research suggests it can. A study of 179 large publicly traded firms found that companies emphasizing data-driven decision making had output and productivity 5 to 6 percent higher than expected, given their other investments and their use of information technology (Brynjolfsson et al., 2011).
A later study using Census Bureau data on manufacturing plants found that the use of data-driven decision making nearly tripled, from 11 percent to 30 percent, between 2005 and 2010. The authors also noted that adoption was more common in larger plants and in plants with strong information technology and educated workers (Brynjolfsson & McElheran, 2016). You can read more about this research through the National Bureau of Economic Research.
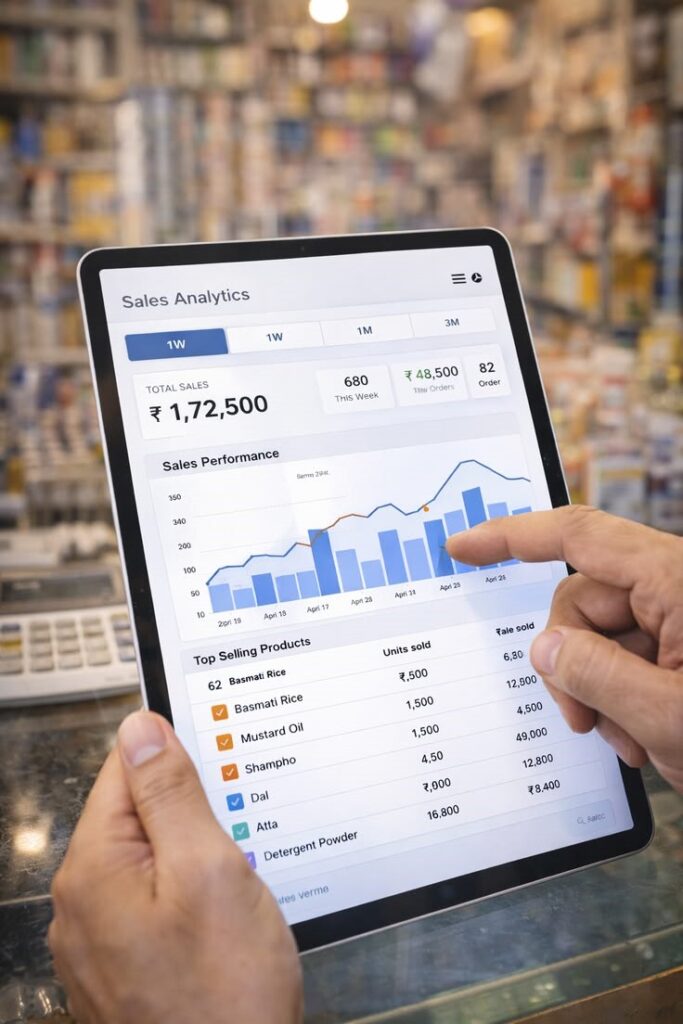
Notice what that second finding implies. Success depends on more than buying a tool. People, skills and habits matter just as much. I have seen smaller organizations chase fancy predictive software before they could answer a basic question like “which product earns us the most?” That is backwards, in my opinion. If the descriptive layer is messy, a fancy model only produces confident nonsense. And confident nonsense is worse than honest uncertainty.
So my advice is to climb the ladder one step at a time. First, clean and organize the data you already have. Second, build a few clear reports that answer questions managers actually ask. Third, test a simple forecast on one problem, such as inventory or staffing. Only then should you think about optimization tools that recommend actions. I know this sounds less exciting than jumping straight to artificial intelligence. But slow progress builds trust, and trust is what makes analytics stick.
I also want to say something about trust. Analytics should support human judgment, not replace it. Numbers can miss context, such as a new competitor or a sudden shift in customer mood. The best decision makers combine data with experience and curiosity. They ask questions like “does this number make sense given what I am seeing on the ground?” That kind of healthy skepticism keeps analytics honest.
If you are studying for an MBA or running a small business, start with one question today and answer it with data. You may be surprised how much clarity a basic spreadsheet can give. Business analytics does not have to be intimidating. It just has to be useful. For related reading, see our piece on forecasting and our overview of logistics.
If you are wondering where to find that first question worth answering, look at the decisions you already make every week. Maybe you keep guessing how much stock to order. Maybe you are unsure which marketing channel actually brings in customers. Those small, recurring decisions are perfect starting points for business analytics. I have found that the best questions are the ones you are already asking out loud, just without any data behind them. Write one down today and see what your records say.
And please do not wait for perfect data. I made that mistake early on, convinced I needed everything cleaned up before I could trust any insight. The truth is that messy data used carefully still beats a gut feeling used blindly. Start with what you have, note the gaps, and improve as you go. Business analytics rewards momentum more than perfection, and that is a lesson I wish I had learned sooner.
References
Brynjolfsson, E., Hitt, L. M., & Kim, H. H. (2011). Strength in numbers: How does data-driven decisionmaking affect firm performance? SSRN. https://papers.ssrn.com/abstract=1819486
Brynjolfsson, E., & McElheran, K. (2016). The rapid adoption of data-driven decision-making. American Economic Review, 106(5), 133–139. https://dspace.mit.edu/handle/1721.1/108650
Data-driven prescriptive analytics applications: A comprehensive survey. (2024). arXiv. https://arxiv.org/pdf/2412.00034